Food For After Thought
Canadian crime rates in the penalty box
Simon Demers*
EDITOR’S INTRODUCTION
The following feature represents the first paper to which the Journal of CSWB has assigned a new article category, Food for After Thought. With thanks to this author, and with encouragement to others in the future, we welcome the opportunity to showcase items that might serve to remind us from time to time, no matter how important our work might be to others, never to take our own work, our own data, or ourselves too seriously.
Some say that noted engineer and statistician W. Edwards Deming once said, “In God we trust … all others must bring data.” Others credit him for saying, on another occasion, “Information is not knowledge. Let’s not confuse the two”. The celebrated sports journalist Howard Cosell once famously said, “Sports is human life in microcosm”.
The degree to which this current paper resonates with any of these quotes, and/or sheds any light on our understanding or lack of understanding of safety and well-being in our communities, is left entirely to the reader. – Norman E. Taylor, Editor-in-Chief
ABSTRACT
Over the 1962 to 2016 period, the Canadian violent crime rate has remained strongly correlated with National Hockey League (NHL) penalties. The Canadian property crime rate was similarly correlated with stolen base attempts in the Major League Baseball (MLB). Of course, correlation does not imply causation or prove association. It is simply presented here as an observation. Curious readers might be tempted to conduct additional research and ask questions in order to enhance the conversation, transition away from a state of confusion, clarify the situation, prevent false attribution, and possibly solve a problem that economists call identification.
KEYWORDS: Crime, penalties, stolen bases, correlation, hockey, baseball, NHL, MLB
INTRODUCTION
This short research note highlights surprisingly strong correlations between Canadian aggregate crime trends and certain professional sport trends that were observed throughout the 1962 to 2016 period.
Beyond any entertainment value, these empirical relationships provide new opportunities to test, validate or refute criminological theories. In the United States, for example, there appears to be a strong negative correlation between measures of consumer sentiment and rates of not only robbery and property crime (Rosenfeld & Fornango, 2007) but also homicide (Blumstein & Rosenfeld, 2008) and felony homicide in particular (Rosenfeld, 2009). This suggests that changing economic conditions can have an impact on crime. Similarly, divorce rates and crime rates also seem to move together over time (Greenberg, 2001), supporting the idea that major social changes and family strains can engender crime.
DATA
The analysis relies on police-reported data compiled by Statistics Canada as part of its Uniform Crime Reporting (UCR) Survey. The aggregate UCR Survey data permit historical comparisons back to 1962 (Allen, 2018). Following convention, crime numbers are converted into rates per 100,000 resident population to facilitate year-over-year comparisons that take into account population growth. The focus of the analysis is on violent crime, property crime, and homicide rates.
Penalty data for the National Hockey League (NHL) were extracted directly from its official website (NHL.com, 2018). These NHL data include the total number of penalties (Pen) and the associated number of penalty infraction minutes (PIM) for each season.
Batting data for the Major League Baseball (MLB) were downloaded from the website Baseball-Reference.com (2018). These MLB data include various statistics intending to reflect offensive productivity. The analysis focuses on stolen base attempts or stolen base opportunities, which is the combination of stolen bases (SB) and “caught stealing” events (CS).
RESULTS
Violent Crime in the NHL Penalty Box
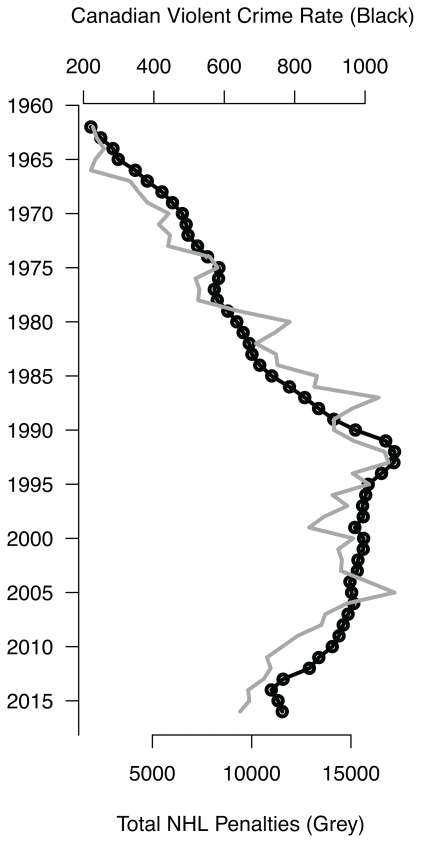
First, it turns out that the Canadian violent crime rate is positively correlated with the number of NHL penalties and penalty minutes in a surprisingly strong manner, as measured by Pearson’s correlation coefficients (r = 0.951 and 0.925, respectively). Figure 1 illustrates the quality of the linear fit. The ordinal association is also quite strong, as measured by Kendall’s rank correlation coefficients (τ = 0.775 and 0.750, respectively).
| |

|
|
|
FIGURE 1 Canadian violent crime rate and NHL penalties, 1962–2016. Two NHL lockouts shortened the 1994–95 and 2012–13 regular seasons to 48 games instead of 82 games per team. The totals for those seasons are manually adjusted (normalized) to account for lost games and to make year-over-year comparisons possible. For its part, the 2004 NHL lockout led to a completely cancelled season. In that case, fictitious 2004 data are imputed by simply interpolating between 2003 and 2005 data points.
|
This statistical relationship is notable because NHL penalties are typically assessed by referees for excessive toughness and physical violence and are, therefore, the closest thing to a violent crime in the context of professional ice hockey (Heckelman & Yates, 2003), besides actual on-ice criminal assaults (CityNews Staff, 2016).
Possible underlying factors that could drive such a strong correlation between violent crime and NHL penalties include all factors that professional hockey players would have been exposed to with essentially the same timing and same intensity as the rest of the general population. This could plausibly encompass, for example, early childhood lead exposure (Nevin, 2000; Nevin, 2007; Wolf, 2014) and a social civilizing or pacifying process (Spierenburg, 2001; Stille, 2003; Restrepo, 2015).
The latter argument is a sociological one. It is based on the idea that society in general may have become more enlightened over the last few decades. Better self-control and social pressures would therefore explain parallel reductions in both crime and on-ice penalties. The former argument is built on the idea that hockey players who played in the NHL throughout the late 1980s and early 1990s may have been exposed to harmful amounts of lead when they were growing up in the 1960s and 1970s, before leaded gasoline and lead-based paint became regulated. In contrast, hockey players born after the mid-1970s were more likely to grow up with healthier brains and a lower propensity for violence. Canadians and Canadian youths in particular would have been similarly affected.
It is not possible, at this stage, to completely eliminate the possibility that NHL penalties might actually “stimulate” violent crime at the national level, through some kind of copycat or emulation effect, for instance (Moser, 2004; Adubato, 2011; Card & Dahl, 2011; Kirby, Francis, & O’Flaherty, 2014). Although this may sound far-fetched at first glance, earlier studies did reveal some correlation between the success of sports teams and reductions in suicide (Joiner, Hollar, & Van Orden, 2006), and even homicide rates (Fernquist, 2000). In fact, some studies examined the relationship between homicide rates and the introduction of television in certain countries and found a consistently positive correlation between the two (Centerwall, 1989), revealing that not only televised sport—but television more generally—has the potential to engender violence in society (Centerwall, 1992).
We note, in passing, that the correlation between violent crime and NHL penalties is unlikely to be explained away by annual weather or temperature variations (Burke, Hsiang, & Miguel, 2015) because NHL games are generally played in a climate-controlled environment, unlike baseball (Reifman, Larrick, & Fein, 1991; Larrick, Timmerman, Carton, & Abrevaya, 2011) or American football games (Craig, Overbeek, Condon, & Rinaldo, 2016), for instance.
Property Crime Around the Baseball Diamond
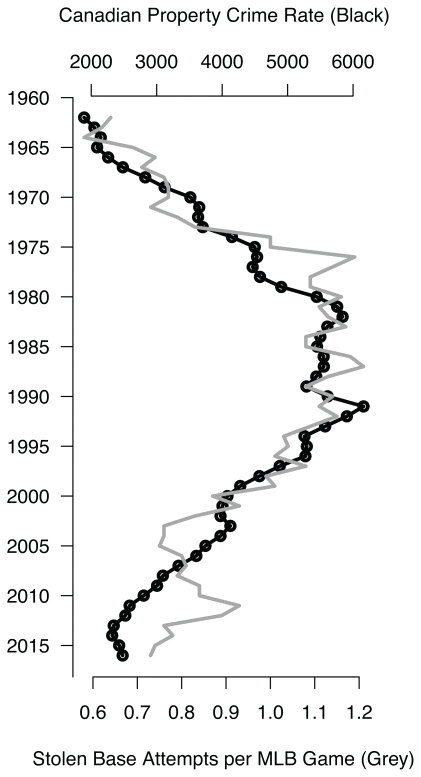
Second, it turns out that the Canadian property crime rate is positively correlated with the rate of stolen base attempts in the MLB (r = 0.894 and τ = 0.696). Figure 2 illustrates the quality of the linear fit.
| |

|
|
|
FIGURE 2 Canadian property crime rate and stolen base attempts in the MLB, 1962–2016. Three significant MLB strikes resulted in lost games during the 1972, 1981, 1994, and 1995 seasons. However, the MLB data are averaged on a per-game basis, which removes the need to normalize the data or simulate full seasons in order to account for lost games.
|
Stolen base attempts reflect the propensity of baseball players to opportunistically try to move forward around the bases at the expense of the defensive team, in order to possibly score more runs as a result. Stolen base opportunities can, therefore, properly be seen as the professional baseball equivalent of a lawful property crime.
Plenty of explanations have been professed to explain the relative rise of base stealing in the mid-1970s (McMurray, 2015), its peak throughout the 1980s (James, 1982), and its decline in the mid-1990s (Kurkjian, 1994). However, identifying the underlying factors that could explain why stolen bases in the MLB may be related to property crime in Canada remains an open problem.
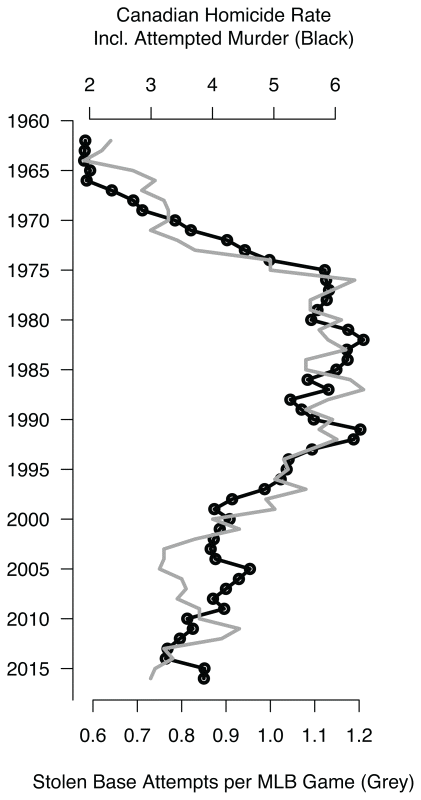
As a side note, Farrell, Hodgkinson, & Andresen (2018) already highlighted that there was a remarkable similarity between historical property crime and homicide rates in Canada, once attempted murders and actual homicides are aggregated into a single measure of total homicides (r = 0.91). In that context, and in light of the previously discussed results, it should not come as a surprise that Canadian homicides and attempted murders, like property crimes, are also correlated with stolen base attempts (r = 0.894 and τ = 0.695). This is shown by Figure 3.
| |

|
|
|
FIGURE 3 Canadian homicide rate and stolen base attempts in the MLB, 1962–2016. The Canadian homicide rate is actually correlated most strongly with failed stolen base attempts where the runner was caught stealing (r = 0.822), while the rate of attempted murders is actually correlated most strongly with successful stolen bases (r = 0.906). This may look incongruent at first glance, but this is only because stolen bases are defined from the point of view of the runner. From the point of view of the defensive team, a runner who is caught stealing represents a successful out.
|
Farrell, Hodgkinson, & Andresen (2018) speculated that similarities between historical homicide and property crime rates may have been driven by the progressive implementation of security improvements, especially in the second half of the 1990s. While it is not immediately obvious whether (or how) this security hypothesis may also apply to stolen base opportunities in the MLB, more research into this area could be enlightening (and probably entertaining).
CONCLUSION
Correlation does not imply causation and it is entirely possible that the statistical relationships presented in this short research note may be coincidental or spurious, in the vein of Andersen (2012) and Vigen (2015), for example. However, they also very well could be examples of life imitating sports (Steen, 2014) or vice versa (Goldstein, 1989).
More research would obviously be required to assess whether these statistical relationships are purely coincidental, to determine to what extent both trends might be influenced by common underlying factors, and to investigate the possibility that they might be fueled endogenously through a copycat effect, among many other possible pathways.
CONFLICT OF INTEREST DISCLOSURES
The author declares there are no conflicts of interest.
AUTHOR AFFILIATIONS
*Planning, Research & Audit Section, Vancouver Police Department, Vancouver, BC..
REFERENCES
Adubato, B. (2011). Fanning the flames: Televised, professional football games and domestic violence. Newark, NJ: Rutgers PhD Dissertation. doi:10.7282/T347498K

Allen, M. (2018, July 23). Police-reported crime statistics in Canada, 2017. Canadian Centre for Justice Statistics. Statistics Canada. Retrieved from https://www150.statcan.gc.ca/n1/pub/85-002-x/2018001/article/54974-eng.htm
Andersen, E. (2012, March 23). True fact: The lack of pirates is causing global warming. Forbes Blog. Retrieved from https://www.forbes.com/sites/erikaandersen/2012/03/23/true-fact-the-lack-of-pirates-is-causing-global-warming/
Baseball-Reference.com. (2018, September 7). Major League Baseball batting year-by-year averages. Retrieved from https://www.baseball-reference.com/leagues/MLB/bat.shtml
Blumstein, A., Rosenfeld, R. (2008). Factors contributing to U.S. crime trends In A. S. Goldberger, R. Rosenfeld (eds.), Understanding crime trends: Workshop report (pp. 13–44). Washington DC: The National Academies Press. Retrieved from https://www.nap.edu/read/12472/chapter/3
Burke, M., Hsiang, S. M., Miguel, E. (2015). Climate and conflict. Annual Review of Economics, 7(1), 577–617. doi:10.1146/annurev-economics-080614-115430

Card, D., Dahl, G. B. (2011). Family violence and football: The effect of unexpected emotional cues on violent behavior. The Quarterly Journal of Economics, 126(1), 103–143. doi:10.1093/qje/qjr001

Centerwall, B. S. (1989). Exposure to television as a risk factor for violence. American Journal of Epidemiology, 129(4), 643–652. doi:10.1093/oxfordjournals.aje.a115180

Centerwall, B. S. (1992). Television and violence: The scale of the problem and where to go from here. Journal of the American Medical Association, 267(22), 3059–3063. doi:10.1001/jama.1992.03480220077031

CityNews Staff. (2016, February 9). Some notable on-ice incidents that led to criminal charges. Toronto, ON: CityNews Toronto. Retrieved from https://toronto.citynews.ca/2016/02/09/some-notable-on-ice-incidents-that-led-to-criminal-charges/
Craig, C., Overbeek, R. W., Condon, M. V., Rinaldo, S. B. (2016). A relationship between temperature and aggression in NFL football penalties. Journal of Sport and Health Science, 5(2), 205–210. doi:10.1016/j.jshs.2015.01.001

Farrell, G., Hodgkinson, T., Andresen, M. A. (2018). Homicide in Canada and the crime drop. Crime Science, 7(1), 1–3. doi:10.1186/s40163-017-0076-y

Fernquist, R. M. (2000). An aggregate analysis of professional sports, suicide, and homicide rates: 30 U.S. metropolitan areas, 1971–1990. Aggression and Violent Behavior, 5(4), 329–341. doi:10.1016/S1359-1789(98)00012-3

Goldstein, J. H. (ed). (1989). Violence in sports In Sports, games, and play: Social and psychological viewpoints (pp. 279–297). Hillsdale, NJ: Lawrence Erlbaum Associates.
Greenberg, D. F. (2001). Time series analysis of crime rates. Journal of Quantitative Criminology, 17(4), 291–327. doi:10.1023/A:1012507119569

Heckelman, J. C., Yates, A. J. (2003). And a hockey game broke out: Crime and punishment in the NHL. Economic Inquiry, 41(4), 705–712. doi:10.1093/ei/cbg038

James, B. (1982, September 6). So what’s all the fuss? New York, NY: Sports Illustrated. Retrieved from https://www.si.com/vault/1982/09/06/624392/so-whats-all-the-fuss
Joiner, T. E., Hollar, D., Van Orden, K. (2006). On Buckeyes, Gators, Super Bowl Sunday, and the Miracle on Ice: “Pulling together” is associated with lower suicide rates. Journal of Social and Clinical Psychology, 25(2), 179–195. doi:10.1521/jscp.2006.25.2.179

Kirby, S., Francis, B., O’Flaherty, R. (2014). Can the FIFA World Cup Football (Soccer) tournament be associated with an increase in domestic abuse? Journal of Research in Crime and Delinquency, 51(3), 259–276. doi:10.1177/0022427813494843

Kurkjian, T. (1994, May 30). Baseball. New York, NY: Sports Illustrated. Retrieved from https://www.si.com/vault/1994/05/30/106786564/baseball
Larrick, R. P., Timmerman, T. A., Carton, A. M., Abrevaya, J. (2011). Temper, temperature, and temptation: Heat-related retaliation in baseball. Psychological Science, 22(4), 423–428. doi:10.1177/0956797611399292

McMurray, J. (2015). Examining Stolen Base Trends by Decade from the Deadball Era through the 1970s. Baseball Research Journal, Fall 2015. Retrieved from https://sabr.org/research/examining-stolen-base-trends-decade-deadball-era-through-1970s
Moser, C. A. (2004). Penalties, fouls, and errors: Professional athletes and violence against women. Sports Law Journal, 11, 69–75.
Nevin, R. (2000). How lead exposure relates to temporal changes in IQ, violent crime, and unwed pregnancy. Environmental Research, 83(1), 1–22. doi:10.1006/enrs.1999.4045


Nevin, R. (2007). Understanding international crime trends: The legacy of preschool lead exposure. Environmental Research, 104(3), 315–336. doi:10.1016/j.envres.2007.02.008

NHL.com. (2018, September 5). Statistics - Teams - Season By Season - Regular Season – Penalties [corporate website]. Retrieved from http://www.nhl.com/stats/team?report=penaltiesreportType=seasonseasonFrom=19601961seasonTo=20172018gameType=2filter=gamesPlayed,gte,1sort=seasonId,teamFullName
Reifman, A. S., Larrick, R. P., Fein, S. (1991). Temper and temperature on the diamond: The heat-aggression relationship in Major League Baseball. Personality and Social Psychology Bulletin, 17(5), 580–585. doi:10.1177/0146167291175013

Restrepo, P. (2015, November). The Mounties and the origins of peace in the Canadian Prairies. Working Paper. Cambridge, MA: MIT. doi:10.13140/RG.2.1.4725.5121

Rosenfeld, R. (2009). Crime is the problem: Homicide, acquisitive crime, and economic conditions. Journal of Quantitative Criminology, 25(3), 287–306. doi:10.1007/s10940-009-9067-9

Rosenfeld, R., Fornango, R. (2007). The impact of economic conditions on robbery and property crime: The role of consumer sentiment. Criminology, 45(4), 735–769. doi:10.1111/j.1745-9125.2007.00096.x

Spierenburg, P. (2001). Violence and the civilizing process: Does it work? Crime, Histoire Societes / Crime, History Societies, 5(2), 87–105. doi:10.4000/chs.740

Steen, R. (2014). Floodlights and touchlines: A history of spectator sport. London, UK: Bloomsbury Publishing PIC.
Stille, A. (2003, May 3). Did knives and forks cut murders? Counting backward, historians resurrect crime statistics and find the middle ages more violent than now. New York, NY: The New York Times, p. B7. Retrieved from https://www.nytimes.com/2003/05/03/arts/did-knives-forks-cut-murders-counting-backward-historians-resurrect-crime.html
Vigen, T. (2015). Spurious correlations. New York, NY: Hachette Books.
Wolf, L. K. (2014). The crimes of lead: Research on the toxic metal’s effects on the brain bolsters the hypothesis that childhood exposure is linked to criminal acts. Chemical Engineering News, 92(5), 27–29. Retrieved from https://cen.acs.org/articles/92/i5/Crimes-Lead.html
Correspondence to: Simon Demers, Planning, Research & Audit Section, Vancouver Police Department, 3585 Graveley St., Vancouver, BC, V5K 5J5. E-mail: simon.demers@vpd.ca
(Return to Top)
This work is licensed under the Creative Commons Attribution-NonCommercial-NoDerivatives 4.0 International License. To view a copy of this license, visit http://creativecommons.org/licenses/by-nc-nd/4.0/. For commercial re-use, please contact marketing@multi-med.com.
Journal of CSWB, Vol. 3, No. 3, December 2018


